The Situation: Fragmented Resilience in a High-Stakes Environment
The client operates one of the largest regional logistics hubs in Hamburg, managing a complex network of 50 decentralized branches. Each branch functioned as a semi-autonomous unit, relying on local servers for critical operations such as warehouse management, employee time tracking, and ERP integration. While this distributed model offered operational flexibility, it created a significant security and resilience blind spot.
IT security was fragmented, with no unified strategy for disaster recovery (DR). Recovery processes were handled manually via on-premises backup servers and sporadic cloud storage, lacking any centralized monitoring capability. In the event of a server outage, IT technicians had to physically visit the site or connect via remote support to execute manual scripts. This approach resulted in average recovery times ranging from 45 to 90 minutes per site. In a logistics context, where every minute of downtime translates directly into delayed shipments and potential contractual penalties, this latency was unacceptable.
The pain points were clear and compounded by regulatory pressures. First, the high Recovery Time Objective (RTO) of 45–90 minutes posed a direct threat to service level agreements. Second, the reliance on manual processes meant that recovery depended heavily on the availability of specific IT staff, creating a single point of failure. Third, there was a lack of visibility; no central dashboard existed to provide a real-time health status of all 50 sites. Finally, the company faced compliance risks under NIS2, as recoverability requirements were neither fully documented nor automated, leaving the organization vulnerable to audit failures.
The Challenges
To address these issues, we identified four concrete challenges that had to be solved before any automation could be successful:
- Heterogeneous Infrastructure: The 50 sites did not have a uniform hardware or software baseline. Some ran older Windows Server versions, while others used newer Linux distributions. This heterogeneity made it difficult to create a one-size-fits-all recovery script.
- Alert Fatigue: Existing monitoring systems generated too many false positives. IT staff were overwhelmed with non-critical alerts, leading to a risk that a genuine failure signal would be missed or delayed.
- Lack of API Connectivity: The backup solution (Veeam) and the monitoring tool were not natively integrated. There was no mechanism to automatically trigger a restore job based on a specific performance degradation.
- Documentation Gap: DR procedures existed only in the heads of senior IT staff. There was no centralized, version-controlled documentation that could be audited or used for training new employees.
The Tech Stack
We selected a robust, open-source-friendly stack to ensure scalability and cost-efficiency:
- PRTG Network Monitor: Served as the central nervous system for real-time visibility across all 50 sites.
- Ansible: Used for infrastructure-as-code, specifically for orchestrating automated failover and recovery tasks.
- Azure Cloud: Hosted the central management plane, ensuring high availability for the monitoring and automation controllers.
- Veeam Backup & Replication: The existing backup engine, integrated via API to allow programmatic restore triggers.
- PowerShell: Used for custom scripting within Ansible playbooks to handle specific legacy system quirks.
Implementation: From Chaos to Orchestration
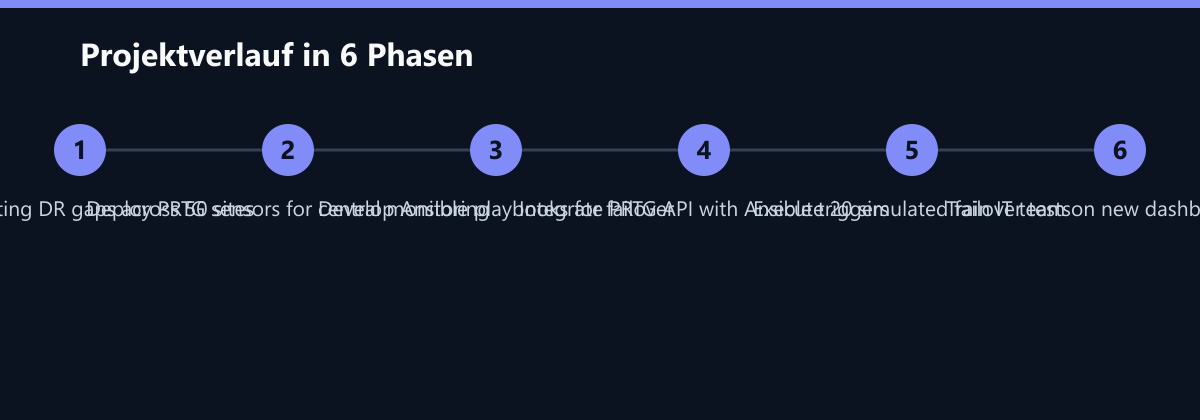
We established a centralized monitoring and automation setup in the Azure cloud. The architecture relied on a tight coupling between PRTG for detection and Ansible for action. The project was executed in three distinct phases over 12 weeks to minimize risk to ongoing operations.
Phase 1: Monitoring Integration (Weeks 1–4)
The first priority was visibility. We deployed PRTG sensors on all 50 locations, configuring them to monitor network latency, server CPU/RAM utilization, and, crucially, backup status. We built a central dashboard that provided a unified view of the entire logistics network. Alerts were defined based on strict RTO criteria, ensuring that only critical failures would trigger the next steps. This phase established the baseline for what constituted a “healthy” state for each site.
Phase 2: Automation with Ansible (Weeks 5–8)
With visibility in place, we moved to action. We developed a library of Ansible playbooks designed for automated failover control. These playbooks handled tasks such as restarting services, promoting standby servers, and initiating Veeam restore jobs. The key innovation was the integration of the PRTG API with the Ansible controller. When PRTG detected a critical alert (e.g., server unresponsive for 5 minutes), it automatically triggered the corresponding Ansible playbook. This eliminated the human decision loop, reducing latency from minutes to seconds.
Phase 3: Testing & Optimization (Weeks 9–12)
Before going live, we executed 20 simulated failover scenarios across different site types. We fine-tuned alert thresholds to reduce false positives, ensuring that the system only acted on genuine incidents. We also conducted training sessions for the internal IT team, teaching them how to interpret the new dashboard and how to intervene if the automation failed. This phase was critical for building trust in the new system.
How We Measured It
To ensure the solution delivered tangible value, we defined clear KPIs before implementation began. We used PRTG’s historical data to establish baseline metrics for RTO and MTTR. For automation rate, we tracked the number of recovery events that required no human login or command execution. Compliance was measured by the completeness of audit logs generated by Ansible. All data was collected automatically by the monitoring stack, ensuring objectivity and eliminating manual reporting errors.
The Results: Speed, Scale, and Compliance
The new system fundamentally transformed disaster recovery processes. Manual intervention was reduced to a minimum, and the IT department regained full control over the 50 sites. The shift from reactive firefighting to proactive automation was immediate and measurable.
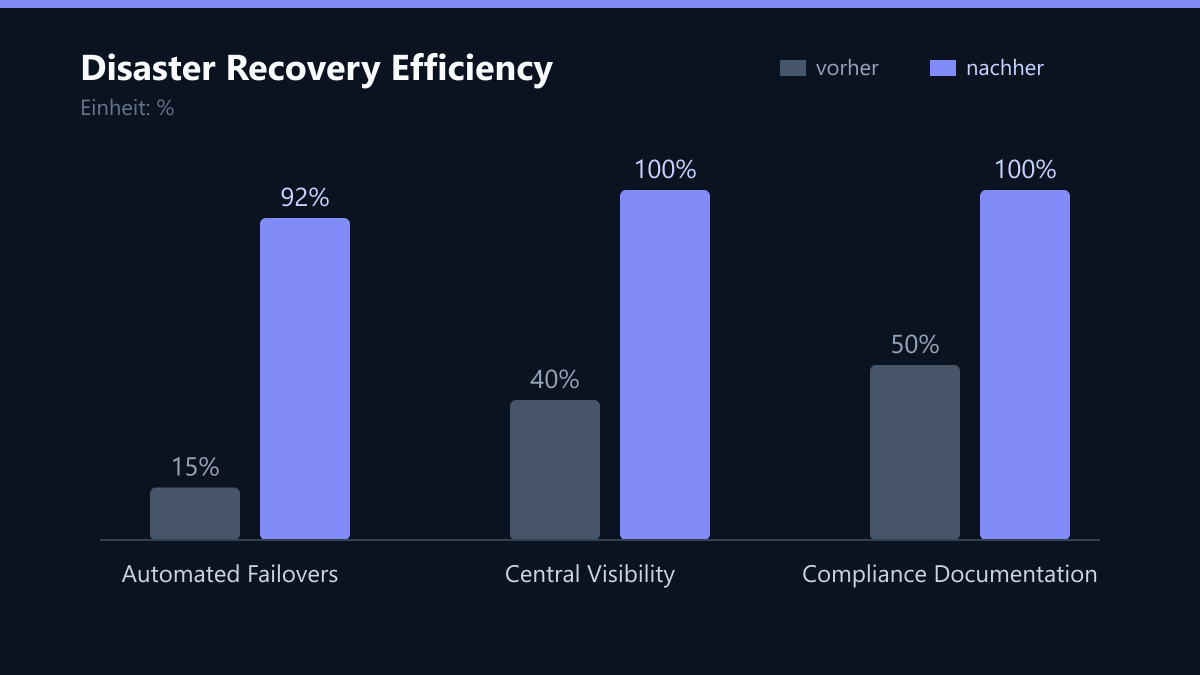
Key Performance Indicators after 6 Months:
- RTO Reduction: The average recovery time dropped from 45–90 minutes to under 15 minutes per site. This was achieved by eliminating the manual intervention step and automating the failover logic.
- Automation Level: 92% of failover scenarios were executed without any human interference. The remaining 8% required manual review due to complex, non-standard errors, which were then documented and added to the playbook library.
- MTTR Improvement: Mean Time to Repair was reduced by 60%, as technicians no longer spent time diagnosing basic outages. They could focus on root cause analysis for the rare complex issues.
- Compliance: The system generated complete audit logs for all recovery operations, ensuring full NIS2 compliance. Every action was timestamped, logged, and attributed to the automated process.
Before/After Comparison:
| Metric | Before | After |
|---|---|---|
| RTO (Recovery Time Objective) | 45–90 Min. | < 15 Min. |
| Manual Steps per Incident | 5–7 | 0–1 |
| Central Visibility | Fragmented | 100% Centralized |
| Compliance Documentation | Partial | Complete |
Lessons Learned: What We Would Do Differently
While the project was a success, we identified areas for improvement that we would address in future engagements.
- Standardize Hardware Earlier: The heterogeneity of the 50 sites required significant custom scripting in Phase 2. If we had standardized the server hardware and OS versions in a pre-project phase, the Ansible playbooks would have been simpler and more robust. We recommend a “standardization sprint” before automation.
- Enhance Alert Granularity: In the early weeks, we found that some alerts were too broad, triggering playbooks for minor issues that self-resolved. We would now implement a two-stage alert system: a “warning” stage that logs the issue, and a “critical” stage that triggers automation, with a 5-minute buffer to allow for self-healing.
- Invest More in Training: The IT team initially struggled with the shift from manual to automated workflows. We would allocate more time for change management and hands-on workshops to ensure the team feels confident in the new system from day one.
The success of this project hinged on the tight coupling of monitoring and automation. PRTG alone would have only generated alerts, while Ansible alone would not have known when a failover was necessary. By integrating these tools via API, we created a self-healing infrastructure that meets the high demands of modern logistics.