The Initial Situation
A mid-sized B2B SaaS provider in Munich, employing 85 people, found itself in a common but costly predicament. Despite steady business growth, their Azure infrastructure bills were rising disproportionately. The root cause was not a lack of resources, but a lack of visibility. The engineering team operated in a fragmented environment where operational metrics were scattered across different dashboards, leading to manual scaling errors and occasional downtime during peak usage hours.
The situation was exacerbated by a heavy reliance on basic, static Azure alerts. These alerts were often too generic to provide early warning signs of impending issues, resulting in reactive rather than proactive incident management. Furthermore, the DevOps team was bogged down by routine manual tasks. Engineers were spending approximately 15 hours per week on manual scaling adjustments, a significant drain on their capacity for innovation and strategic work. The organization needed a solution that could provide real-time visibility, automate resource management, and ultimately reduce their cloud expenditure without compromising service reliability.
The Challenges
Addressing this issue presented several concrete challenges that had to be overcome to achieve the desired outcome:
- Fragmented Visibility: Data silos between Azure and other monitoring tools made it difficult to get a holistic view of system performance and cost drivers.
- Static Scaling Policies: Existing auto-scaling rules were based on scheduled times rather than real-time load, leading to over-provisioning during low-traffic periods and under-provisioning during spikes.
- Alert Fatigue: The volume of low-priority alerts was overwhelming, causing critical signals to be missed and reducing the team’s responsiveness to genuine incidents.
- Cost Opacity: Without granular, real-time cost tracking, the team could not identify specific services or configurations contributing to budget overruns until after the bill was generated.
The Tech Stack
To address these challenges, we implemented a hybrid monitoring and automation strategy using the following tools:
- AWS CloudWatch: Served as the centralized monitoring and alerting hub, aggregating data from both Azure and AWS environments.
- Azure Virtual Machines: The primary compute resources being monitored and scaled.
- Azure Auto Scaling Groups: Configured to respond to CloudWatch-triggered alarms for dynamic resource adjustment.
- CloudWatch Cost Explorer Integration: Used to track and analyze Azure spend patterns in real-time.
- Custom Dashboards: Built in CloudWatch to visualize unified metrics for CPU, memory, network, and cost anomalies.
Implementation Approach
Our implementation strategy focused on creating a unified monitoring layer that bridged the gap between Azure and AWS tools. We began by deploying CloudWatch agents across the client’s Azure environment to collect granular performance metrics. This allowed us to build a central dashboard that aggregated data from all critical services, providing a single pane of glass for the engineering team.
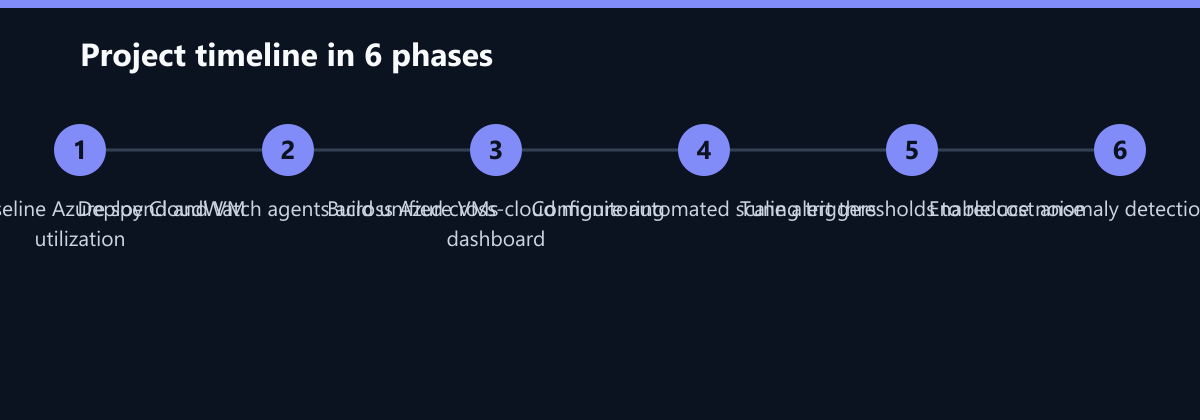
The core of the solution involved reconfiguring the scaling logic. Instead of relying on static schedules, we set up CloudWatch alarms to trigger Azure Auto Scaling Groups based on real-time load indicators such as CPU utilization and memory usage. This ensured that resources were provisioned only when needed and scaled down immediately after demand decreased. Additionally, we implemented cost anomaly detection workflows. By integrating CloudWatch with cost tracking tools, the system could flag unusual spending patterns instantly, allowing the team to investigate and rectify issues before they resulted in significant financial loss.
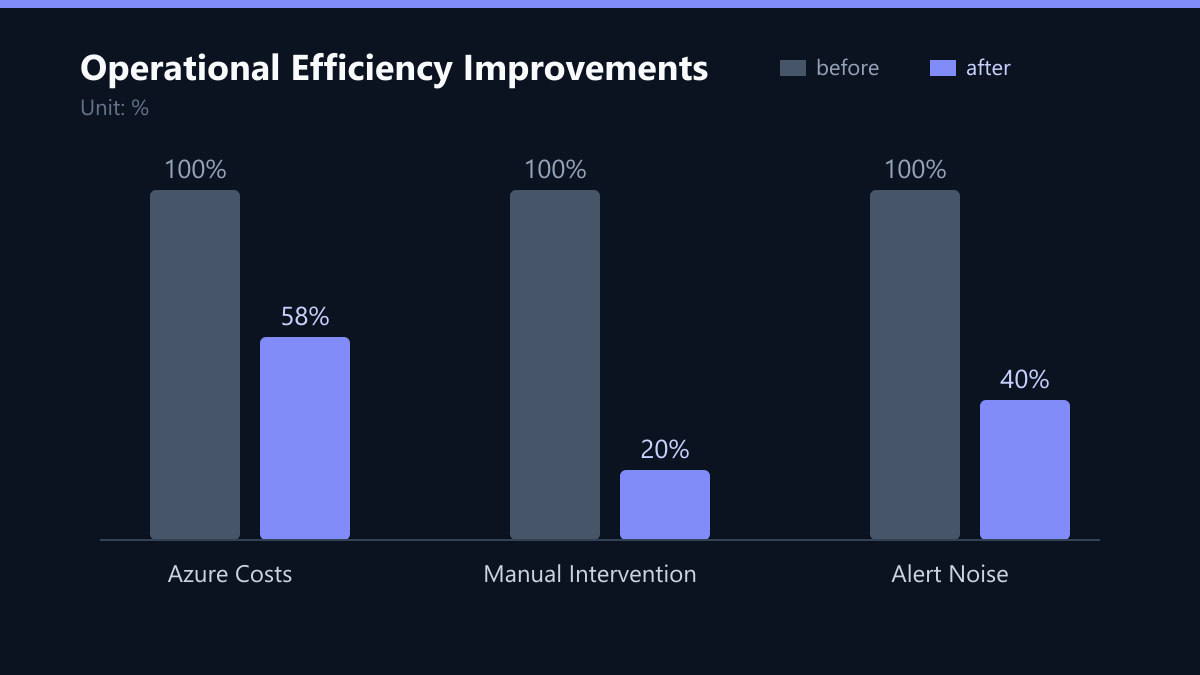
A crucial part of the implementation was alert optimization. We analyzed the existing alert rules and identified sources of noise. By tuning thresholds and grouping related events, we reduced the volume of non-critical alerts by 60%. This allowed the DevOps team to focus on high-priority incidents, improving their overall efficiency and response time.
How We Measured It
To ensure the effectiveness of the solution, we established a clear set of KPIs and measurement methods. Baseline data was collected for four weeks prior to implementation to establish a control group. We tracked monthly Azure infrastructure costs, service uptime, manual intervention time for scaling tasks, and mean time to detect (MTTD) critical issues. Cost data was pulled directly from Azure billing APIs and cross-referenced with CloudWatch cost explorer data. Uptime was measured using synthetic transactions and health checks. Manual intervention time was tracked via time-tracking logs from the DevOps team. MTTD was calculated from incident logs, measuring the time between the occurrence of a critical event and the first alert notification.
The Outcomes
Within three months of full deployment, the infrastructure became significantly more resilient and cost-efficient. The automated scaling ensured that resources matched actual demand precisely, eliminating the waste associated with over-provisioning. The unified monitoring dashboard provided the engineering team with the visibility needed to make informed decisions quickly.
The results were substantial: a 42% reduction in monthly Azure infrastructure costs, a significant improvement in service uptime from 99.95% to 99.99%, and an 80% decrease in manual DevOps intervention time for scaling tasks. Furthermore, the mean time to detect critical infrastructure issues was reduced to less than 5 minutes, allowing for faster response and mitigation.
These improvements not only saved the company money but also enhanced the reliability of their SaaS platform, leading to higher customer satisfaction and reduced churn. The engineering team was able to redirect their time from routine maintenance to developing new features and improving the product experience.
Lessons Learned
This case study highlights several key lessons for organizations looking to optimize their cloud infrastructure. First, cross-cloud monitoring is not just about visibility; it enables smarter resource allocation across providers. By using a unified monitoring platform, organizations can gain a more granular view of their infrastructure than native tools alone can provide. Second, standardizing alerting logic across different cloud platforms reduces cognitive load for engineering teams, allowing them to focus on solving problems rather than navigating complex interfaces.
Third, treating cost monitoring as an operational discipline is crucial. By flagging cost anomalies as operational incidents, organizations can prevent budget overruns before they become financial problems. Finally, automation pays off. The initial setup time of two weeks was recovered in the first month of operational savings, demonstrating the high ROI of investing in automated scaling and monitoring solutions.
What We Would Do Differently Today
While the project was successful, there are areas where we would refine our approach if we were to repeat it. First, we would invest more time in stakeholder alignment during the initial phase. Engaging non-technical stakeholders earlier in the process would have helped in setting clearer expectations regarding the benefits and limitations of the solution. Second, we would consider implementing a phased rollout of the automated scaling rules. Starting with a subset of services and gradually expanding to the entire infrastructure would have allowed for more granular testing and adjustment of thresholds, potentially reducing the risk of unintended consequences. Third, we would integrate more advanced predictive analytics into the monitoring stack. By using machine learning to predict demand spikes, the system could proactively scale resources before they are needed, further optimizing costs and performance.
Passend dazu
- IT Consulting & IT Strategy
- AI Consulting & AI Strategy
- Cloud Services & Cloud Migration
- IT Compliance & Data Protection
- E-Commerce Development
- NIS2 Implementation Checklist: The 10 Technical Controls for DACH Critical Infrastructure
- Retail: Reducing Phishing-Related Downtime by 40% with Sentinel and Intune in the DACH Region