The Context: Rising Costs in a High-Performance Environment
The client is a specialized biotech R&D firm based in Singapore, operating with a headcount of 250 employees. Their facility is designed for high-intensity research, requiring robust IT infrastructure to support data-heavy workloads and laboratory management systems. However, the building’s infrastructure had not kept pace with modern efficiency standards. Aging HVAC systems and unmonitored IT power consumption had created a significant blind spot in operational expenditures.
Over a two-year period, energy bills had climbed by 22% without any corresponding increase in productivity or output. The IT infrastructure was running continuously, 24/7, regardless of whether researchers were present in the lab or office. This constant draw on power, combined with inefficient cooling that did not account for actual heat loads, resulted in substantial waste. Management recognized that a data-driven approach was no longer optional but necessary to control costs without compromising the critical uptime required for ongoing research projects.
The Challenges
Before deploying any automation, we identified four specific hurdles that had to be addressed to ensure a successful rollout:
- Lack of Granular Visibility: The existing utility meters only provided building-level data. Without rack-level or zone-level insights, it was impossible to pinpoint which assets were responsible for the highest waste.
- Thermal Coupling Issues: The HVAC system operated on a fixed schedule, often overcooling server rooms when IT loads were low and undercooling them during peak processing times. This inefficiency wasted energy on cooling air that didn’t need to be conditioned.
- Risk to Critical Workloads: In an R&D environment, unexpected power events or forced reboots can corrupt data or interrupt long-running simulations. Any power management strategy had to be fail-safe for critical assets.
- Cross-Departmental Silos: IT and Facilities Management had historically operated independently. Optimizing power required a unified view where IT heat output directly influenced HVAC decisions, necessitating new communication protocols between the two teams.
How We Measured It
To ensure the results were verifiable and not just anecdotal, we established a rigorous measurement framework before touching a single cable.
Baseline Establishment: We conducted a 4-week energy audit. During this period, we installed temporary logging devices to capture consumption patterns across servers, workstations, and HVAC units. This data served as our “before” state, allowing us to normalize for weather variations and seasonal demand.
Sensor Deployment: We installed smart power sensors at the rack level in the server room and in key office zones. These sensors provided real-time data on voltage, current, and power factor.
KPI Definition: We defined three primary Key Performance Indicators (KPIs) to track success:
- Overall Energy Consumption: Measured in kWh, comparing the monthly total against the baseline average.
- Peak Load Charges: Measured in currency, tracking the cost associated with the highest demand intervals.
- Uptime: Measured as a percentage of time critical services were available, ensuring no degradation in service levels.
By correlating sensor data with utility bills, we could isolate the impact of our interventions from external factors like grid pricing changes.
The Tech Stack
We utilized a mix of hardware and software tools to create a cohesive smart power management ecosystem:
- IoT Power Sensors: Rack-level devices to capture real-time consumption data per server and switch.
- Building Management System (BMS) Integration: Middleware to bridge IT data with the existing HVAC controls.
- Power Management Policies: Custom scripts and agent-based tools to enforce sleep states on non-critical assets.
- Dashboarding Platform: A central interface for IT and Facilities teams to monitor real-time metrics and historical trends.
- Load Shifting Scheduler: A tool to move non-critical batch jobs to off-peak hours to reduce peak load charges.
Implementation Strategy
The implementation was structured into a phased approach to minimize disruption to the research environment. The total duration for the core deployment was 6 weeks, following the initial 4-week audit phase.
We began by integrating the IoT sensors into the existing network infrastructure. This allowed us to start collecting granular data immediately. Simultaneously, we configured power management policies for non-critical IT assets. These policies were designed to put workstations and non-essential servers into deep sleep modes during nights and weekends, when research activity was minimal.
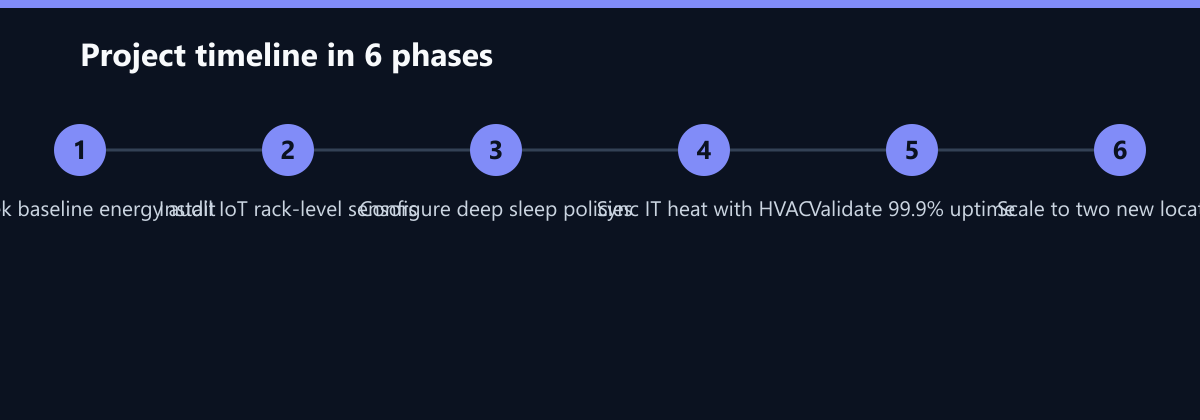
A critical component of the strategy was the synchronization of IT heat output with the HVAC system. We fed real-time data from the rack sensors into the Building Management System. This allowed the HVAC to dynamically adjust cooling output based on actual heat generation rather than a static schedule. If the IT load dropped, the cooling reduced, preventing overcooling and saving significant energy. Conversely, if a heavy computation started, the system would ramp up cooling proactively to maintain optimal temperatures.
We also implemented a load-shifting mechanism for non-critical workloads, such as data backups and non-urgent analytics processing. By moving these tasks to off-peak hours, we reduced the peak demand on the grid, which directly lowered the peak load charges on the utility bill.
Throughout the 6-week implementation, we maintained a strict change management process. All policy changes were tested in a staging environment before being applied to production. This ensured that no unexpected power events occurred for critical research servers.
Results and Impact
The project delivered measurable cost savings and improved sustainability metrics within the first quarter of operation. The data-driven approach allowed us to target the most inefficient areas with precision.
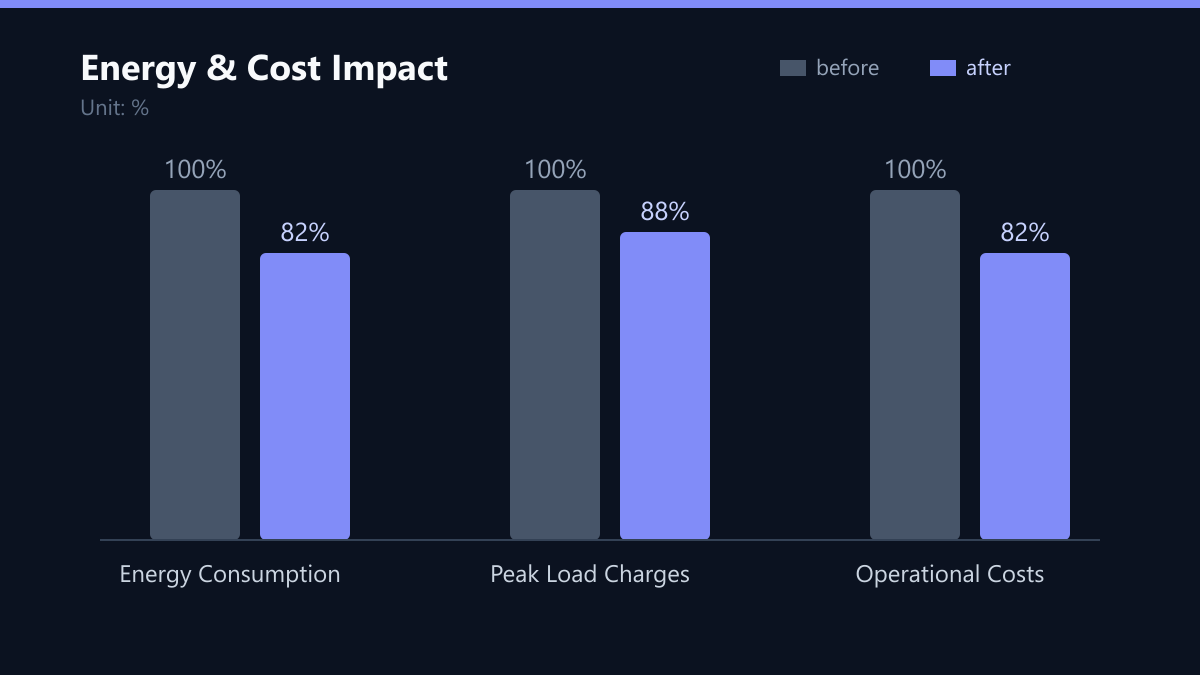
The most significant outcome was an 18% reduction in overall office energy consumption. This was achieved primarily through the elimination of unnecessary power draw during off-hours and the optimization of cooling efficiency. Additionally, we saw a 12% decrease in peak load charges by successfully shifting non-critical workloads to off-peak periods.
In financial terms, these efficiencies translated to $45,000 in annual savings in electricity costs. Given the initial investment in sensors and integration, the solution paid for itself within 14 months. Importantly, these savings were achieved while maintaining 99.9% uptime for critical R&D servers, ensuring that research operations were not disrupted.
The client has since expanded the solution to two additional office locations in the region, replicating the success achieved in the primary facility. This expansion demonstrates the scalability of the approach and its applicability to multi-site organizations.
What We Would Do Differently Today
While the project was successful, there are areas where we would refine the approach based on lessons learned:
- Earlier HVAC Integration: We initially treated HVAC synchronization as a secondary phase. In retrospect, integrating this from the start of the audit would have provided a more complete picture of the building’s thermal dynamics and allowed for more precise baseline measurements.
- User Education: We focused heavily on technical implementation but could have invested more in educating non-technical staff about the new power management policies. Some initial confusion arose when workstations entered sleep mode unexpectedly, which was mitigated by improved communication but could have been prevented.
- Longer Baseline Period: While a 4-week audit is standard, a 6-week period might have captured more seasonal variations, providing an even more robust baseline for long-term tracking.
Lessons Learned and Best Practices
This project highlighted several key takeaways for organizations looking to optimize their energy usage:
Data-Driven Decisions are Essential: Without real-time sensor data, optimization efforts remain speculative. The granular visibility provided by IoT sensors was the foundation for all successful interventions.
Cross-Departmental Collaboration is Critical: Success required close cooperation between IT, facilities management, and finance teams. Breaking down silos and creating a shared view of energy consumption was vital for identifying and implementing efficient solutions.
Continuous Optimization is Required: Energy usage is not static. As workloads change and new technologies are adopted, power policies must be regularly reviewed and adjusted. We established a quarterly review process with the client to ensure ongoing efficiency.
Sustainability and Cost Efficiency Go Hand in Hand: Reducing energy consumption not only lowered operational costs but also contributed to the client’s sustainability goals, enhancing their corporate social responsibility profile.
This case study demonstrates that smart power management is a viable and effective strategy for reducing energy costs in high-tech R&D environments. By combining IoT sensing, automation, and cross-system integration, organizations can achieve significant savings without compromising operational uptime.
Passend dazu
- Office 365 Admin Center Guide: Managing Users, Groups, and Licenses Efficiently
- The ROI of AI Agents: Calculating Savings in Customer Service and Back-Office
- Hybrid Office & Workplace Management
- Networking & Network Infrastructure
- Microsoft 365 & Office 365 Services
- Achieving 99.99 Percent Uptime: Redundant Server Infrastructure for a US Manufacturing Company
- Optimization of Cloud Spend by 28 Percent for a SaaS Provider in the USA Through Resource Usage Visibility
- Digitalization of a Swiss Engineering Firm: 60% Reduction in Email Latency through Exchange Online and Modern Identity Management
- Reducing Helpdesk Ticket Volume by 40% for a German Machine Manufacturer Through Root-Cause Analysis Instead of Reactive Troubleshooting
- Managing Multi-Tenant Office Environments: Best Practices for Shared Infrastructure
- Zero Downtime Fleet Management During New York Regional Power Outage