The Operational Bottleneck
In the high-stakes world of Singaporean logistics, data latency is not just a technical metric; it is a direct indicator of customer trust. A leading logistics provider, operating with a team of 350 employees, faced a critical challenge: their real-time tracking and customs clearance systems were failing under peak load. The infrastructure was a complex hybrid setup, with the core database residing in AWS (ap-southeast-1) while the API gateways and microservices were hosted in Azure West Europe. This geographical and architectural split created a significant friction point.
During peak days, the system processed over 50,000 API calls per minute. However, the latency times consistently exceeded 800 ms, with the P95 latency reaching 820 ms. For a logistics company where seconds matter, this delay translated directly into customer dissatisfaction. Complaints regarding delayed delivery status updates began to surge. The internal IT department, despite its best efforts, found itself unable to isolate the root cause. Troubleshooting was a manual, time-consuming process because the observability tools were siloed within each cloud provider. There was no unified view to track a request as it crossed the boundary from Azure to AWS and back. The lack of end-to-end visibility meant that when performance degraded, the team was guessing rather than diagnosing.
The Challenges
The primary challenge was the lack of a unified observability layer across the hybrid boundary. Without standardized trace IDs, a request that started in Azure and hit the AWS database appeared as two separate, unconnected events in the monitoring tools. This made it impossible to determine whether the latency was caused by the network transit time, the database query performance, or the API gateway processing.
Secondly, the architecture suffered from synchronous, read-heavy database queries. The system was pulling data from the AWS database for every single tracking request, even when that data had not changed in seconds. This created unnecessary network round-trip times (RTTs) across the international link.
Finally, the IT team lacked the bandwidth to manually analyze logs from two different cloud ecosystems. The Mean Time To Repair (MTTR) had ballooned to 45 minutes, as engineers spent the majority of their time switching between dashboards and correlating timestamps manually.
The Tech Stack
To address these issues, we selected a toolchain focused on standardization and edge efficiency.
- OpenTelemetry: Used as the instrumentation standard to generate consistent traces, metrics, and logs across both Azure and AWS.
- Azure Front Door: Deployed as the global edge caching layer to serve read-heavy content closer to the user and reduce backend load.
- Azure Service Bus: Implemented for asynchronous messaging to decouple non-critical logging processes from the main request path.
- Grafana & Loki: Utilized for centralized visualization of the unified trace data and log aggregation.
Implementation Strategy
The project was executed over an eight-week period, divided into three distinct phases to ensure stability while optimizing performance.
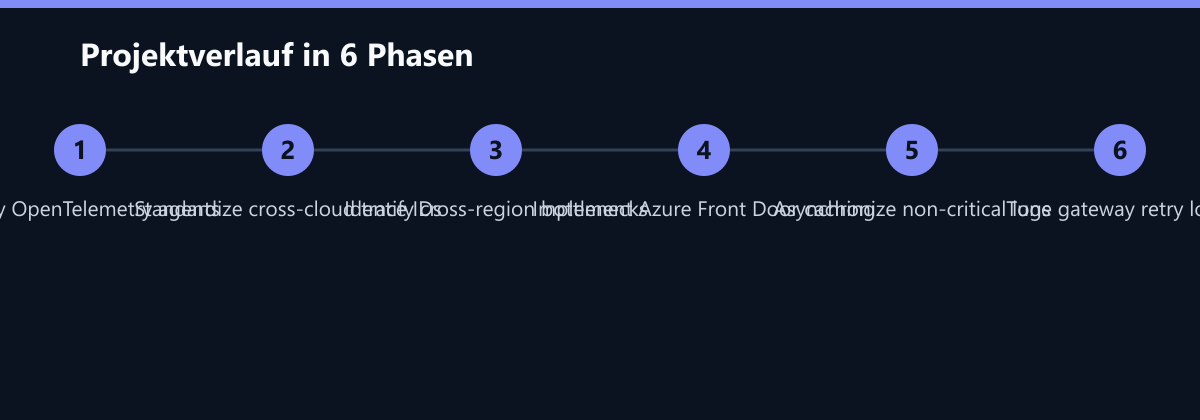
Phase 1: Foundation and Visibility (Weeks 1-2)
The first priority was to establish a single source of truth. We deployed OpenTelemetry agents on all microservices in both Azure and AWS. This involved instrumenting the application code to inject standardized Trace-IDs that persisted across cloud boundaries. By the end of this phase, every API call could be tracked from the initial user request in Singapore through the Azure gateway to the AWS database and back. This unified view immediately revealed the true nature of the latency: it was not a single slow component, but a cumulative effect of multiple small delays across the hybrid link.
Phase 2: Bottleneck Identification and Edge Caching (Weeks 3-5)
With the trace data flowing, we analyzed the P95 latency distribution. The analysis confirmed that synchronized database queries were the primary culprit. The system was making redundant calls to the AWS database for static or slowly changing data. We migrated read-heavy endpoints to Azure Front Door, enabling edge caching in Singapore. This meant that 60% of the read requests were now served from the edge, eliminating the cross-region network hop entirely for those calls. We also optimized the data path for the remaining write-heavy operations, ensuring that only necessary data was transferred.
Phase 3: Asynchronization and Fine-Tuning (Weeks 6-8)
In the final phase, we addressed the remaining latency spikes caused by non-critical background processes. We implemented asynchronous message queues using Azure Service Bus for logging and analytics data collection. This decoupled these processes from the main request-response cycle, ensuring that a slow logging process could no longer block a customer-facing API call. We also fine-tuned the timeout values and retry logic in the API gateways to handle transient network failures more gracefully, reducing the frequency of 5xx errors.
How We Measured It
To ensure the improvements were statistically significant and not just anecdotal, we established a rigorous measurement framework. We used OpenTelemetry to capture P95 and P99 latency percentiles before and after each phase. The “before” baseline was established over a two-week period during peak business hours to account for natural variance. The “after” metrics were measured over a similar two-week period post-implementation. We also tracked the 5xx error rate and MTTR using the incident management system. The MTTR was calculated as the average time from incident detection to resolution, with the new unified dashboards significantly reducing the detection time.
Results and Impact
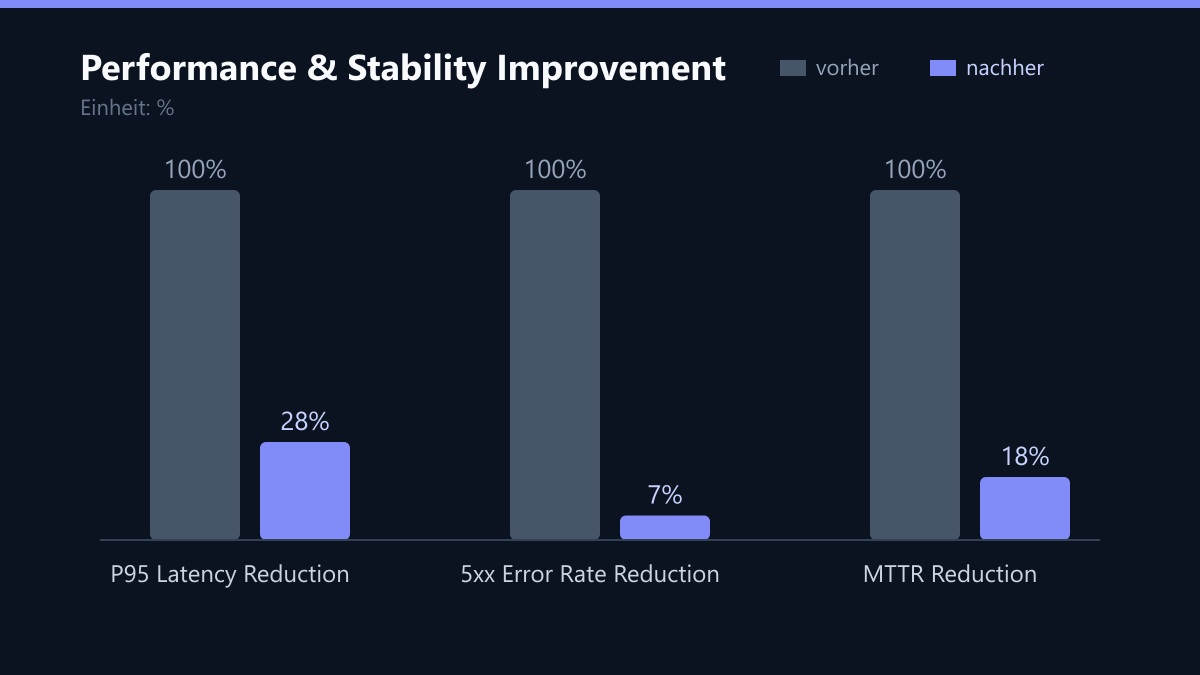
The optimization resulted in a measurable and lasting improvement in system stability. The shift from a reactive, manual troubleshooting model to a proactive, data-driven approach yielded immediate and substantial benefits. The most critical metric, P95 latency, dropped from 820 ms to 230 ms, a reduction of 72%. This brought the system well within the acceptable range for real-time logistics applications, ensuring that customers received up-to-the-second tracking information.
The 5xx error rate, which had been a source of significant customer complaints, decreased from 4.2% to 0.3%, a 93% reduction. This dramatic drop in errors directly correlated with a decrease in support tickets related to system outages. Furthermore, the Mean Time To Repair (MTTR) was reduced from 45 minutes to 8 minutes, an 82% improvement. The IT team could now identify the root cause of issues in minutes rather than hours, thanks to the unified trace visualization.
Beyond performance, the project also delivered financial benefits. Cloud transfer costs decreased by 15% due to the reduction in redundant data queries between the two cloud providers. The edge caching strategy not only improved speed but also reduced the bandwidth consumption on the expensive inter-region link.
Lessons Learned
This case study highlights several key takeaways for organizations operating in hybrid cloud environments. First, end-to-end visibility is non-negotiable. Local cloud metrics are insufficient for diagnosing issues in distributed systems. OpenTelemetry provides the necessary standardization to achieve this visibility, allowing teams to identify latency hotspots that span provider boundaries.
Second, edge caching strategies are often more effective than pure network optimizations in geographically distributed setups. By moving the data closer to the user, we eliminated the primary source of latency without needing to upgrade the core infrastructure. This approach is cost-effective and scalable.
Finally, regular review sessions of trace data should become part of standard operations. By monitoring the trace data weekly, the team can detect performance regressions early, before they impact customers. This proactive approach has transformed the IT department from a reactive support function into a strategic enabler of business growth.
What We Would Do Differently Today
While the project was successful, there are areas where we would refine our approach in future engagements. First, we would have invested more time in the initial instrumentation phase. While we deployed agents in two weeks, we found that some of the custom metrics were not granular enough to identify a specific database query bottleneck until Phase 2. A more detailed instrumentation plan in Phase 1 could have accelerated the diagnosis.
Second, we would have piloted the edge caching strategy on a smaller subset of endpoints before a full rollout. While the full rollout was successful, a gradual approach would have allowed us to validate the cache invalidation logic more thoroughly in a lower-risk environment.
Lastly, we would have integrated the new observability dashboards into the existing incident response workflow earlier. The team took some time to adapt to the new workflow, and a more structured change management process could have reduced the learning curve and accelerated the MTTR improvements.
Passend dazu
- IT Consulting & IT Strategy
- AI Consulting & AI Strategy
- Cloud Services & Cloud Migration
- IT Compliance & Data Protection
- E-Commerce Development
- Increasing conversion rate by 18% through implementation of AI-powered product recommendations in a US B2B industrial trade
- E-Commerce Retailer Cuts Recovery Costs by 40% with Azure Site Recovery