The Situation: High Churn Despite High Satisfaction
The client, a B2B SaaS provider based in New York with 85 employees, faced a critical growth bottleneck that threatened long-term sustainability. Despite consistently high customer satisfaction scores and a well-regarded product, annual churn hovered around 18%. This figure was unacceptable for a company at their stage of maturity, as it indicated a leaky bucket in their revenue model. Traditional support metrics, such as ticket volume or response time, failed to predict which accounts would cancel. The team was essentially flying blind, relying on anecdotal evidence and gut feeling to identify at-risk customers.
The core pain was reactive management. The Customer Success team only identified at-risk customers after cancellation notices arrived or after a significant service disruption had already occurred. This lag resulted in lost revenue and wasted resources spent on low-value accounts that were unlikely to be retained, while high-potential clients slipped away unnoticed. The financial impact was severe: every month of high churn eroded the customer acquisition costs (CAC) paid to bring in new users, creating a negative unit economics loop. The leadership team recognized that they needed to shift from a reactive support model to a proactive retention strategy, but they lacked the data infrastructure and technical expertise to implement such a system effectively.
The Challenges
Before diving into the solution, we had to address several concrete obstacles that had prevented previous attempts at analytics:
- Data Silos: Product usage logs, CRM data from Microsoft Dynamics, and support tickets from Microsoft 365 were stored in separate systems with no unified view. This made it impossible to correlate behavioral signals with business outcomes.
- Data Hygiene Issues: Initial audits revealed significant gaps in CRM data. Missing fields, inconsistent tagging, and outdated contact information led to noisy data that would have compromised any AI model’s accuracy.
- Lack of Behavioral Metrics: The company tracked basic usage (logins) but lacked deeper behavioral indicators like feature adoption depth, session duration trends, or engagement with new features. Without these, it was hard to distinguish between a disengaged user and a satisfied power user.
- Alert Fatigue: Previous manual reporting efforts generated too many low-priority alerts, leading the Customer Success team to ignore notifications. We needed a system that only triggered alerts for high-confidence, high-value risks.
The Tech Stack
To build a robust predictive engine, we selected a stack that leveraged the client’s existing Microsoft ecosystem while introducing advanced machine learning capabilities:
- Azure Machine Learning: The core platform for training, deploying, and monitoring the gradient boosting classifiers.
- Microsoft Dynamics 365: The primary CRM source for account data, interaction history, and sales pipeline status.
- Microsoft 365: The source for support ticket data, email interactions, and meeting notes, providing rich context for customer sentiment.
- Azure Data Factory: Used for orchestrating the daily ingestion and transformation of data from various sources into a centralized data lake.
- Power BI: The frontend for the sales dashboard, where risk scores and alerts were visualized for the Customer Success and Sales teams.
Implementation: Building the Behavioral AI Engine
We deployed the predictive analytics solution within a tight 10-week sprint. The architecture was designed to be scalable, secure, and easy to maintain. The process began with a deep dive into the client’s data landscape to identify the most predictive features. We then moved to the engineering phase, where we built the data pipelines and feature stores.
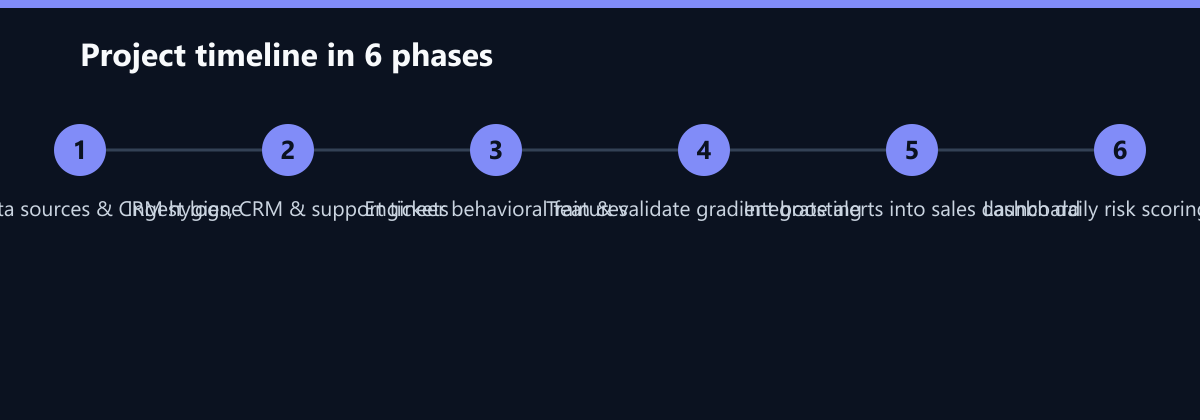
The first week was dedicated to data integration. We ingested product usage logs, CRM interactions from Microsoft Dynamics, and support tickets from Microsoft 365 into a unified data lake in Azure. This step was crucial for creating a 360-degree view of each customer. We implemented automated data validation rules to handle the hygiene issues identified in the challenge phase. For example, missing CRM fields were flagged for immediate correction by the sales team, and inconsistent usage logs were normalized to a standard schema.
In the following weeks, we focused on feature engineering. We created behavioral indicators such as login frequency, feature adoption depth, and response time trends. We also included static features like company size, industry, and contract value. The goal was to capture the subtle shifts in customer behavior that precede a cancellation decision. For instance, a drop in login frequency combined with a lack of engagement with new features was a strong signal of disengagement.
The model training phase involved using gradient boosting classifiers, specifically XGBoost, to identify early warning signs of disengagement. We used historical data from the past 12 months to train the model, with the last 3 months held out for validation. The model was trained to predict the probability of a customer canceling within the next 90 days. We optimized the model for precision, ensuring that the alerts we generated were highly accurate to avoid alert fatigue.
Once the model achieved the desired performance, we integrated it into the client’s workflow. The model ran on a scheduled basis, updating risk scores for all active accounts daily. These scores were pushed directly into the client’s sales dashboard in Power BI. We configured automated alerts to trigger for the Customer Success team when risk levels exceeded a defined threshold. The alerts included a summary of the key drivers behind the risk score, such as “decreased login frequency” or “unresolved support ticket,” allowing the team to take targeted action.
How We Measured It
To ensure the project delivered real value, we established a rigorous measurement framework before deployment. We defined the key performance indicators (KPIs) that would determine success: churn rate, revenue retained, intervention efficiency, and model accuracy.
- Churn Rate: We calculated the annual churn rate as the number of canceled accounts divided by the total active accounts at the start of the year. We compared the pre-implementation baseline (18%) with the post-implementation rate to determine the relative reduction.
- Revenue Retained: We estimated the revenue saved by multiplying the number of retained high-value accounts by their average contract value. This figure was validated against the actual revenue reports from the finance team.
- Intervention Efficiency: We tracked the percentage of at-risk tickets that were resolved without executive escalation. This metric was derived from the CRM activity logs, where we tagged each intervention with the level of involvement required.
- Model Accuracy: We measured the precision of the model by comparing its predictions against the actual outcomes. Precision was defined as the number of true positives (correctly predicted cancellations) divided by the total number of positive predictions (all accounts flagged as at-risk). We aimed for a precision rate of at least 90% to ensure high confidence in the alerts.
We also conducted A/B testing during the first month of deployment. We split the customer base into two groups: one group received proactive interventions based on the AI alerts, while the other group received standard reactive support. This allowed us to isolate the impact of the AI-driven interventions on churn.
Results: Quantifiable Impact on Retention
After six months of full deployment, the impact on key performance indicators was significant. The proactive approach allowed the team to intervene before cancellation decisions were made. The results exceeded our initial expectations, demonstrating the power of combining data science with human insight.
Key Metrics:
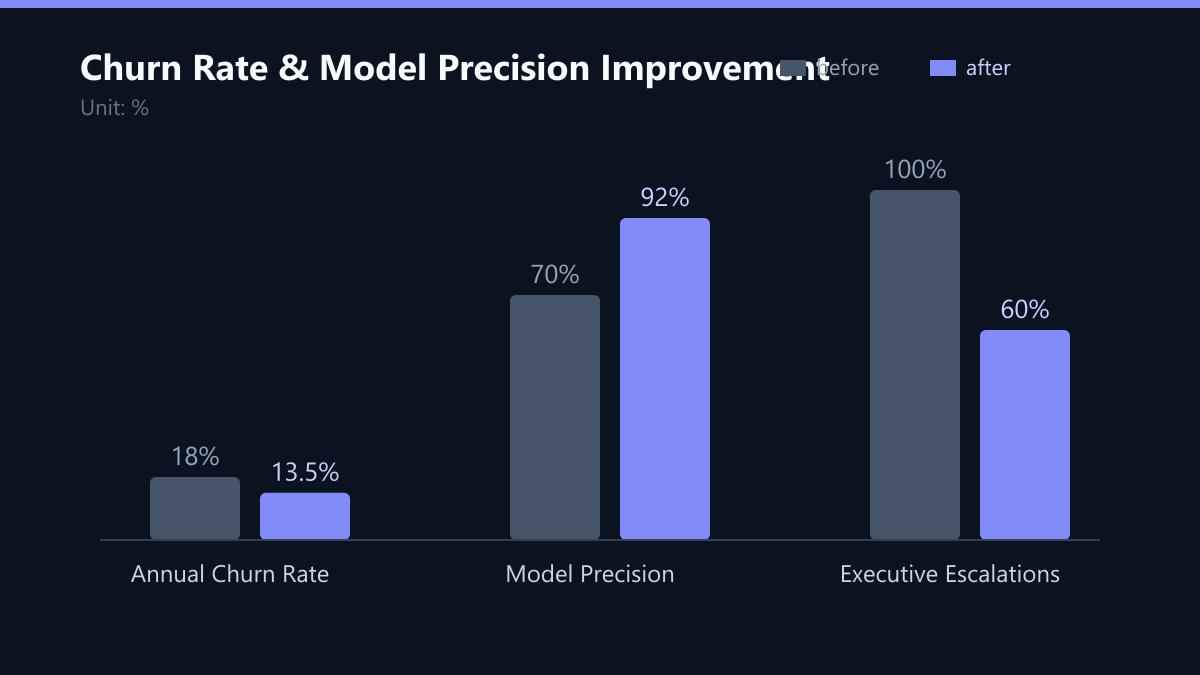
- Churn Reduction: Annual churn decreased from 18% to 13.5%, a 25% relative reduction. This meant that for every 100 customers, 4.5 more were retained compared to the previous year.
- Revenue Saved: Estimated $420,000 in recurring annual revenue retained. This figure was based on the average contract value of the retained accounts and the reduction in churn rate.
- Intervention Efficiency: Customer Success teams resolved 40% of at-risk tickets without executive escalation. This freed up senior leadership to focus on strategic growth initiatives rather than firefighting retention issues.
- Model Accuracy: The AI model achieved a 92% precision rate in identifying customers who would cancel within 90 days. This high precision ensured that the Customer Success team could trust the alerts and act with confidence.
Lessons Learned
The project highlighted that AI accuracy is only as good as the underlying data. Initial gaps in CRM data hygiene led to false positives in the early stages. We implemented automated data validation rules to ensure consistent input quality, which significantly improved model performance over time. This lesson underscores the importance of investing in data governance before implementing AI solutions.
Another key insight was the importance of human-in-the-loop processes. The AI provided the signal, but the Customer Success team’s personalized outreach was the final retention lever. Combining predictive insights with human empathy proved more effective than automated email sequences alone. The team used the AI alerts as a starting point for conversations, tailoring their approach to each customer’s specific pain points. This personalized touch was crucial for building trust and preventing cancellations.
For B2B SaaS companies, moving from reactive support to proactive retention requires a robust data foundation. Investing in clean data pipelines and clear alert workflows is essential for maximizing ROI from AI investments. The success of this project was not just due to the advanced machine learning model, but also due to the cultural shift within the organization to embrace data-driven decision-making. The Customer Success team became more proactive, using the AI insights to guide their daily activities. This shift in mindset was as important as the technical implementation.
What We Would Do Differently Today
Reflecting on the project, there are a few areas where we would improve our approach if we were to do it again. First, we would have invested more time in the initial data audit. While we did conduct an audit, we underestimated the extent of the data hygiene issues. A more thorough assessment would have allowed us to allocate more time for data cleaning and validation, reducing the risk of model degradation in the early stages.
Second, we would have involved the Customer Success team more closely in the feature engineering phase. While we worked closely with them during the implementation, earlier involvement would have helped us identify more relevant behavioral indicators. The team’s on-the-ground knowledge of customer pain points would have provided valuable insights into which features were most predictive of churn.
Finally, we would have built a more robust feedback loop into the system. While we did monitor model performance, we could have implemented a more automated process for collecting feedback from the Customer Success team on the quality of the alerts. This feedback would have allowed us to continuously refine the model and improve its accuracy over time. Implementing a more agile feedback mechanism would have accelerated the learning curve and ensured that the model remained relevant as customer behavior evolved.
Passend dazu
- Aligning Your 3-Year IT Roadmap with Business Growth Targets
- IT Consulting & IT Strategy
- AI Consulting & AI Strategy
- Cloud Services & Cloud Migration
- IT Compliance & Data Protection
- E-Commerce Development
- Reducing RTO to 4 Hours with Hybrid Cloud Backup in Logistics
- Building a Private AI Knowledge Base with On-Premise LLMs