The Strategic Value of IT Visibility
IT is no longer just a support function; it is a core driver of revenue and risk. For a CFO, the IT landscape must be understood through a financial lens. Traditional IT reports often focus on technical uptime, which is useful for sysadmins but irrelevant for financial planning. You need metrics that translate system behavior into business impact. This shift allows you to justify budgets, predict costs, and mitigate financial exposure proactively.
The goal is to move from reactive firefighting to predictive management. By tracking the right indicators, you can identify inefficiencies before they drain cash flow. This approach ensures that every euro spent on technology contributes directly to the company’s bottom line. It also provides a clear audit trail for compliance and governance requirements. Without this visibility, IT remains a black box where costs accumulate without corresponding value delivery.
Metric 1: Mean Time to Resolution (MTTR) and Revenue Impact
Mean Time to Resolution (MTTR) measures the average time taken to restore a service after an outage. While IT teams track this for performance, CFOs must correlate it with lost revenue. Every hour of downtime has a specific financial cost, including halted sales, missed SLAs, and customer churn. Ignoring this correlation leads to underestimating the true cost of IT instability.
To make this metric actionable, calculate the cost per minute of downtime for critical services. Use this figure to evaluate the ROI of faster support contracts or automated recovery tools. A reduction in MTTR from four hours to one hour is not just a technical improvement; it is a direct financial gain. This metric also helps in negotiating better terms with managed service providers by linking their compensation to business continuity. If your critical e-commerce platform costs €500 per minute in lost sales, an MTTR of 4 hours represents a €120,000 loss per incident. Reducing this to 1 hour saves €90,000 immediately.
Metric 2: Cloud Spend Efficiency and Waste
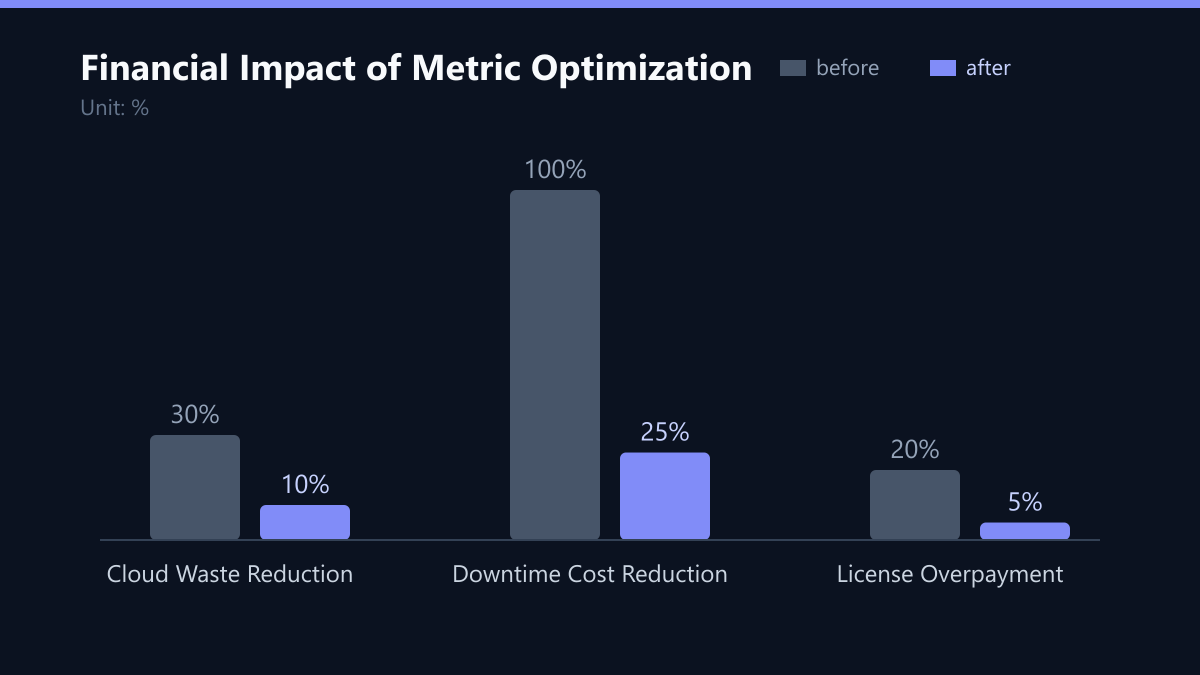
Cloud costs are often variable and opaque, leading to budget overruns. The key metric here is the ratio of active, productive resource usage to total spend. Many organizations pay for idle servers, unattached storage, or over-provisioned instances. This waste can account for 20% to 40% of total cloud bills. Tracking this efficiency ratio reveals where capital is being lost to inefficiency.
Implement automated tagging and cost allocation to identify the most expensive workloads. Compare these costs against the revenue generated by the associated applications. If a specific microservice consumes high resources but drives low revenue, it requires architectural optimization or deprecation. Regular reviews of this metric ensure that cloud spending scales linearly with business growth, rather than exponentially. For example, if your cloud bill grows by 20% but revenue only grows by 5%, you have a significant efficiency problem that requires immediate architectural intervention.
Metric 3: Security Incident Cost and Frequency
Cybersecurity is a financial risk, not just a technical one. Track the frequency of security incidents and the estimated cost of each, including investigation, remediation, and potential regulatory fines. Under the NIS2 directive and GDPR, non-compliance carries severe financial penalties. A single data breach can cost millions in legal fees, reputation damage, and operational disruption.
This metric should include the cost of near-misses and blocked threats. Understanding the volume of attacks helps in justifying investments in advanced security tools like zero-trust architectures or AI-driven threat detection. It also supports insurance negotiations by demonstrating a robust risk management framework. A low incident frequency combined with high detection rates indicates a healthy security posture that protects the company’s balance sheet. Consider the cost of a single ransomware event: forensic investigation, legal counsel, and downtime can easily exceed €500,000. Preventing even one such event through better monitoring pays for the entire security budget for the year.
Metric 4: License Utilization and Compliance
Software licensing is a significant fixed cost for most mid-sized enterprises. The critical metric is the utilization rate of purchased licenses versus actual user activity. Over-licensing leads to wasted capital, while under-licensing creates legal and audit risks. Both scenarios negatively impact the P&L statement. Regular audits of license usage ensure that you are paying only for what you use.
Monitor the adoption rates of new tools, such as Microsoft 365 add-ons or AI assistants. If a tool is purchased but less than 50% of the target audience uses it, it signals a failure in change management or product-market fit. This data helps in making informed decisions about renewals, downgrades, or cancellations. It also prevents compliance violations that could result in substantial penalties from software vendors during audits. For instance, if you license 500 seats of a collaboration tool but only 300 are active, you are wasting 40% of your license budget annually.
Metric 5: IT Change Success Rate
IT changes, whether software updates, infrastructure migrations, or new feature releases, carry inherent risk. The Change Success Rate measures the percentage of changes that are implemented without causing incidents or rollbacks. A low success rate indicates poor testing processes, inadequate documentation, or rushed deployments. Each failed change consumes engineering time and may disrupt business operations.
Track this metric across different change types to identify patterns. If infrastructure changes have a high failure rate, it may point to a lack of automated testing or inadequate staging environments. Improving this rate reduces the hidden costs of rework and emergency fixes. It also increases the velocity of innovation, allowing the business to launch new features faster and capture market opportunities earlier. A success rate below 80% suggests that more time is spent fixing errors than delivering value, directly impacting time-to-market and competitive advantage.
Implementing a CFO-Friendly Dashboard
To effectively track these metrics, you need a unified dashboard that aggregates data from IT monitoring, finance, and security tools. This dashboard should be accessible to non-technical stakeholders and present data in clear, visual formats. Avoid technical jargon; instead, use business terms like ‘Revenue at Risk’ or ‘Cost of Inefficiency.’
Start with a pilot project that focuses on one or two key metrics. Integrate data sources using APIs to ensure real-time accuracy. Assign ownership of each metric to a specific department, such as IT for MTTR and Finance for Cloud Spend. Review these metrics monthly in a joint IT-Finance meeting to align technical actions with financial goals. This collaborative approach ensures that IT strategy remains tightly coupled with business objectives.
Checklist for Implementation
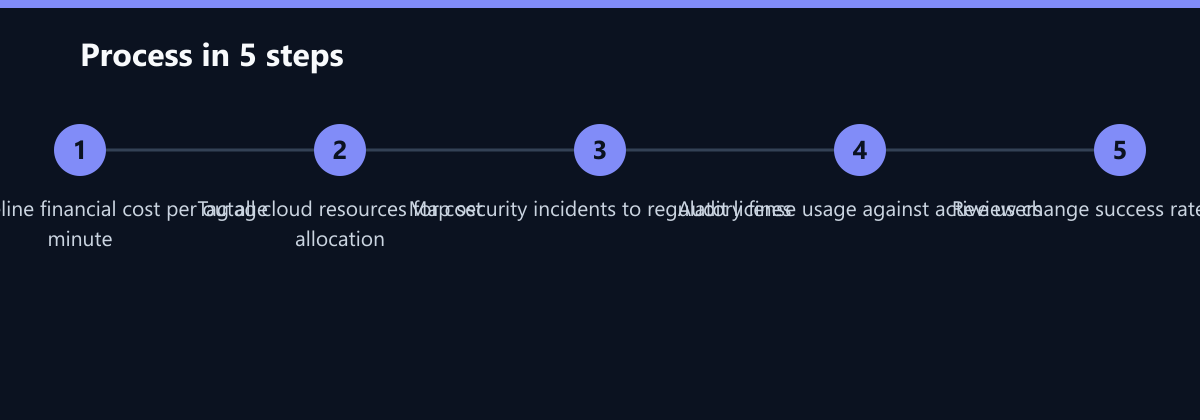
- Define Baseline Costs: Calculate the exact financial cost of one minute of downtime for your top three critical services.
- Tag Cloud Resources: Ensure 100% of cloud resources have cost-center tags for accurate allocation.
- Map Security Risks: List all potential regulatory fines under GDPR and NIS2 relevant to your sector.
- Audit License Usage: Compare active user logs against purchased license counts for all major software suites.
- Track Change Outcomes: Log every production change and mark it as ‘Success’ or ‘Rollback’ for the last quarter.
- Establish Review Cycle: Schedule a monthly 30-minute review with IT and Finance leads to discuss metric trends.
Typical Mistakes to Avoid
Ignoring Indirect Costs: Many CFOs only look at direct spend (licenses, hardware). They miss the massive hidden costs of downtime, inefficient workflows, and security remediation. A holistic view is essential for accurate budgeting.
Lack of Ownership: Metrics without a clear owner become stale. If no one is responsible for improving MTTR or reducing cloud waste, the numbers will not change. Assign specific individuals to each metric.
Technical Jargon: Presenting raw technical data to the board fails to drive action. Translate ‘CPU utilization’ into ‘Cost of Inefficiency’ or ‘Revenue at Risk’ to make the data actionable for business leaders.
Reactive Monitoring: Waiting for a breach or outage to analyze costs is too late. Implement predictive alerts that trigger when spending or incident rates exceed predefined thresholds.
How You Measure Success
To ensure your IT monitoring strategy is delivering financial value, track these specific KPIs:
- Cloud Waste Percentage: Target a reduction from 30% to 10% of total cloud spend within 12 months. Measure this by comparing tagged idle resources to total spend.
- Cost per Incident: Track the average total cost (internal + external) per security incident. Aim for a 20% year-over-year reduction through better prevention and faster response.
- License Utilization Rate: Target a utilization rate of 85-90%. Below 80% indicates over-licensing; above 95% risks under-licensing and audit penalties.
- Change Success Rate: Aim for a success rate above 90%. A rate below 80% indicates significant process inefficiencies that increase operational costs.
Measure these KPIs monthly using automated reports from your monitoring and finance systems. Compare actuals against the baseline established in the first quarter. If cloud waste remains above 20% after six months, escalate to the CIO for architectural review. If the change success rate drops below 85%, pause non-critical deployments and invest in testing infrastructure. This data-driven approach ensures that IT investments are continuously optimized for maximum financial return.