The Illusion of Compliance: Why Completion Rates Lie
Tracking employee training completion rates is a vanity metric. It tells you who clicked ‘submit,’ not who understands the threat. A high completion rate often correlates with low engagement, where staff check the box to move on with their day. This creates a false sense of security for leadership teams who believe their workforce is protected simply because they have seen the slides.
True security culture is behavioral. It is defined by how employees react when they encounter a suspicious email, a lost device, or a social engineering attempt. To measure this, you must look at outcomes, not inputs. This guide outlines five KPIs that provide a clear view of your actual security posture, moving the conversation from “did they watch the video?” to “did they protect the company?”
KPI 1: Phishing Click-Through and Report Rates
The most direct test of security culture is the response to simulated phishing campaigns. Do not just track who clicked the link. Track two distinct metrics: the Click-Through Rate (CTR) and the Report Rate.
- CTR: The percentage of employees who clicked a malicious link. A decreasing trend over time indicates learning.
- Report Rate: The percentage of employees who forwarded the phishing email to the IT security team. This is the critical metric.
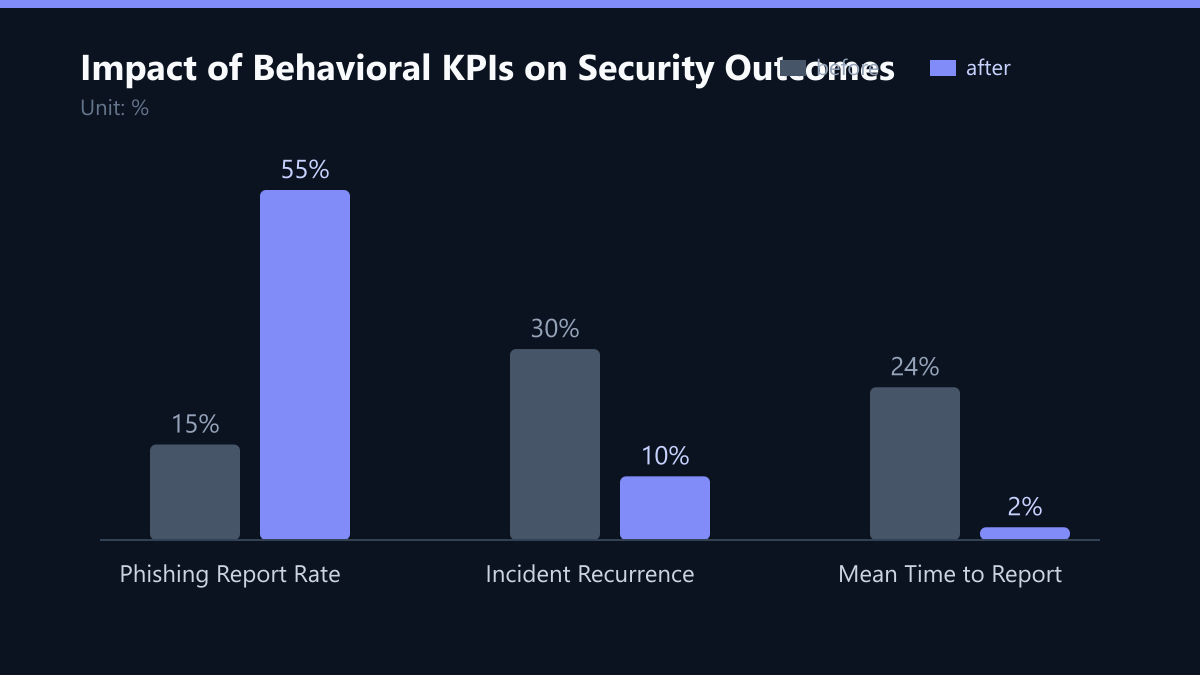
A high report rate proves that employees view security as their own responsibility. If your CTR is low but your report rate is also low, your staff is ignoring threats rather than identifying them. Aim for a report rate above 50% in mature organizations. This metric shifts the focus from ‘avoiding mistakes’ to ‘active defense.’
KPI 2: Time-to-Report Incidents
When a real security incident occurs, speed is everything. The Mean Time to Report (MTTR-Report) measures the average time between an employee noticing a suspicious activity and alerting the IT department. This includes lost laptops, unusual login attempts, or suspected data leaks.
Long reporting times indicate a culture of fear or apathy. Employees may hide mistakes to avoid blame. Short reporting times indicate a blame-free culture where employees trust that reporting an error will lead to a fix, not a firing.
To measure this, integrate incident logging with your ticketing system. Track the timestamp of the user’s initial notification against the timestamp of the event discovery. A target of under 1 hour for critical incidents is a healthy benchmark for mid-sized enterprises.
KPI 3: Policy Acknowledgment vs. Actual Compliance
Many companies track how many employees have signed the Acceptable Use Policy. This is a legal requirement, not a cultural one. To measure culture, track Actual Compliance against policy violations.
Use automated monitoring tools to detect deviations from your security policies. For example:
- USB devices blocked vs. USB devices attempted.
- Multi-Factor Authentication (MFA) enrollment vs. MFA bypass attempts.
- Shadow IT usage vs. approved software usage.
The gap between signed policies and actual behavior reveals your cultural deficit. If 100% of staff sign the policy but 20% still use unauthorized cloud storage, your training is not landing. Measure the Violation Rate per department. This helps you identify which teams need targeted re-education rather than generic broadcasts.
KPI 4: Security Champion Engagement
Security culture is not top-down; it is peer-to-peer. Implement a Security Champion Program where one employee per department acts as a liaison between IT and their team. Measure their engagement, not just their existence.
Track these engagement metrics:
- Number of local workshops held: Did the champion organize a lunch-and-learn on password hygiene?
- Number of peer reports: How many incidents did the champion’s team report directly?
- Response time to peer queries: How quickly does the champion answer security questions from colleagues?
High engagement from champions correlates with lower incident rates in their departments. This KPI measures the social spread of security awareness. It transforms security from an IT burden into a shared team responsibility.
KPI 5: Incident Recurrence Rate
The ultimate test of learning is whether the same mistake happens twice. The Incident Recurrence Rate tracks the percentage of security incidents that are duplicates of previous, already-addressed incidents.
For example, if an employee clicks a phishing link in January, receives targeted retraining, and clicks a similar link in March, the culture is not changing. This KPI measures the retention of security knowledge.
- Low Recurrence Rate: Indicates that feedback loops are working. Employees learn from mistakes.
- High Recurrence Rate: Indicates that training is generic and not addressing specific behavioral gaps.
Analyze recurrence by type of incident. If password resets are recurring, your password policy or MFA implementation is failing. If phishing clicks are recurring, your simulation content is not relevant to the employee’s daily work. This metric ensures that your security program is evolving with your workforce.
Implementation Roadmap: From Data to Culture
Do not try to measure all five KPIs at once. Start with a baseline. Implement phishing simulations and track CTR and Report Rates for three months. Simultaneously, launch a Security Champion program and track their activity.
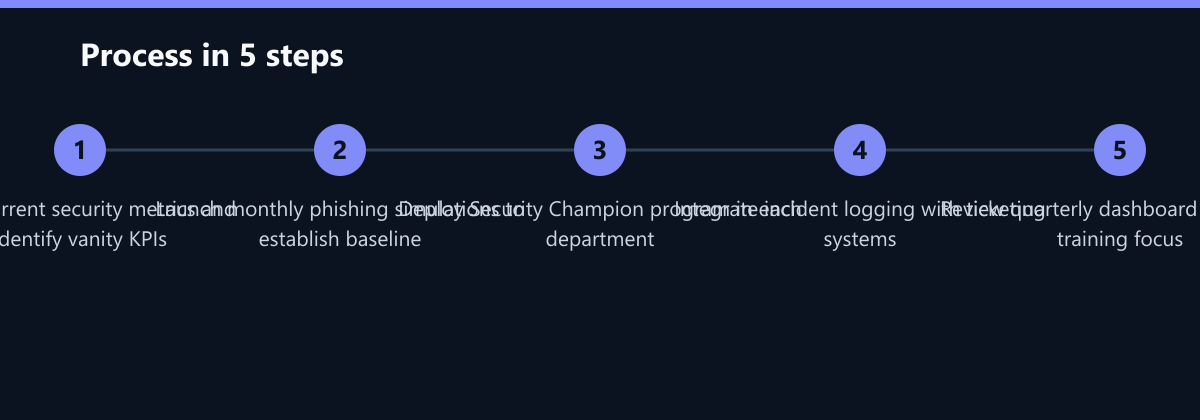
- Audit Current Metrics: Identify which KPIs are currently vanity metrics (e.g., completion rates) and replace them with behavioral ones.
- Launch Simulations: Begin monthly phishing simulations to establish a baseline for CTR and Report Rates.
- Deploy Champions: Select and train one Security Champion per department to act as a peer liaison.
- Integrate Logging: Ensure incident reports are timestamped and linked to ticketing systems for MTTR-Report calculation.
- Quarterly Review: Present KPI trends to leadership, focusing on departmental breakdowns and correlation with incident costs.
Present these KPIs to leadership in a quarterly dashboard. Focus on trends, not absolute numbers. A slight increase in CTR after a complex campaign is normal if the Report Rate increases. Context is key.
- Quarterly Review: Compare KPIs against the previous quarter.
- Departmental Breakdown: Identify laggard teams for targeted intervention.
- Correlation Analysis: Link KPI improvements to reduced incident costs.
By shifting from completion rates to behavioral KPIs, you gain a clear view of your organization’s true security maturity. This data drives budget allocation, training design, and risk management decisions. It turns security from a compliance checkbox into a measurable business asset.
Typical Mistakes to Avoid
- Over-Simulating: Running phishing tests too frequently (e.g., weekly) can lead to alert fatigue. Employees start ignoring all emails, reducing the validity of the CTR data. Stick to monthly for the first six months.
- Punishing Clicks: If employees are punished for clicking a link, they will hide the incident, skewing your Time-to-Report and Recurrence Rate data. The goal is correction, not punishment.
- Ignoring Context: A high CTR in the finance department might be due to a specific scam targeting vendors, not a general lack of awareness. Always analyze KPIs by department and threat type.
- Static Benchmarks: Do not use a single global benchmark for all KPIs. A start-up and a bank have different risk profiles and thus different target values for Report Rates and MTTR.
How You Measure Success
Success is not a single number but a trend line. To measure the effectiveness of your security culture program, track the following KPIs over a 12-month period:
- Report Rate Trend: Look for a consistent upward trend. A jump from 20% to 50% indicates a cultural shift.
- Recurrence Rate Decline: A drop in the Incident Recurrence Rate shows that training is effective and knowledge is retained.
- MTTR Improvement: A reduction in Mean Time to Report indicates increased trust and faster incident response.
Method: Use a quarterly dashboard that compares current quarter KPIs against the previous quarter and the same quarter in the previous year. Correlate these trends with the total cost of security incidents (including downtime and remediation). If KPIs improve but costs remain high, investigate whether the KPIs are aligned with your specific threat landscape.
Checklist for KPI Implementation
- Define Baseline: Record current CTR, Report Rate, and MTTR before launching new initiatives.
- Select Tools: Ensure your security awareness platform can track timestamps and link incidents to users.
- Train Champions: Provide Security Champions with the tools and authority to engage their peers.
- Set Targets: Define realistic targets for each KPI based on industry benchmarks and internal risk appetite.
- Communicate Results: Share KPI trends with employees to show progress and reinforce positive behaviors.
- Review and Adjust: Quarterly, review KPI data and adjust training content or simulation frequency based on findings.