The Hidden Cost of Blind Spots in Mid-Market IT
Modern IT landscapes have moved far beyond simple monoliths. With the rise of microservices, hybrid cloud environments, and dynamic workloads, traditional monitoring is no longer sufficient. Without deep insights into system performance and user experience, blind spots emerge. These gaps lead to prolonged downtime and obscure root causes, turning minor issues into major business disruptions.
Observability is the answer. It goes beyond classic monitoring by enabling you to derive the internal state of a system from its external outputs: logs, metrics, and traces. For mid-market companies, this translates directly into faster troubleshooting, better scalability, and higher service reliability.
However, the platform you choose directly impacts your operational costs and team efficiency. Two leading providers dominate this space: Grafana and New Relic. While both are powerful, they address fundamentally different needs. Choosing the wrong one can lead to either unnecessary complexity or uncontrolled costs.
Grafana: The Power of Flexibility and Control
Grafana is an open-source platform that prioritizes visualization and aggregation. It is not an all-in-one solution but rather a central dashboard that connects to various data sources. This architecture offers significant advantages for organizations that value control.
Key Benefits for the Mid-Market:
- Controlled Costs: The open-source version is free. Costs only arise when using Enterprise features or Managed Services. This allows you to scale spend linearly with actual infrastructure needs rather than data volume.
- Data Sovereignty: You can host data in your own infrastructure or in a cloud of your choice. This simplifies compliance requirements such as GDPR, as you retain full physical and logical control over your data.
- Universal Integration: Grafana connects to almost any backend, including Prometheus, InfluxDB, Elasticsearch, and AWS CloudWatch. This makes it an ideal aggregation layer for heterogeneous environments.
Challenges to Consider:
- Setup Effort: You must configure and manage data collection agents and exporters yourself. This requires dedicated time and expertise.
- Technical Complexity: Connecting multiple data sources and building meaningful dashboards requires technical expertise within the DevOps or SRE team.
- No Built-in APM: Application Performance Monitoring (APM) is not native. You must supplement Grafana with external tools like Jaeger or Zipkin for distributed tracing.
New Relic: Speed and Simplicity in a Single Suite
New Relic is a commercial SaaS platform that bundles metrics, logs, traces, and browser monitoring into a single, cohesive suite. Its primary focus is on simplified administration and rapid time-to-value.
Key Benefits for the Mid-Market:
- Rapid Implementation: Agents are easily installed via standard SDKs. Dashboards and alerts are often available immediately after the first data ingest.
- Simplified Management: There is no overhead for managing your own monitoring stack. New Relic hosts and maintains the infrastructure, freeing your team to focus on development.
- Unified View: All telemetry data flows into a single platform. This reduces the cognitive load for developers who no longer need to switch between multiple tools.
- AI-Powered Alerts: Adaptive alerting features help reduce false positives, ensuring that your team is only notified when it truly matters.
Challenges to Consider:
- Cost Structure: Billing is based on data volume and the number of users. Costs can rise quickly and unpredictably with high data volumes, especially if log retention is not managed strictly.
- Vendor Lock-in: Migrating to another provider is more complex because data resides in the New Relic environment. Exporting historical data for analysis can be difficult.
- Limited Flexibility: For very specific custom requirements or non-standard data sources, you may hit the platform’s limits.
Financial Modeling: Understanding the True TCO
Financial planning is a decisive factor in this decision. Grafana and New Relic have fundamentally different pricing models that affect your Total Cost of Ownership (TCO) in distinct ways.
| Criterion | Grafana | New Relic |
|---|---|---|
| Base License | Free (OSS) | Paid (Freemium) |
| Pricing Factor | Number of Users / Enterprise Features | Ingested Data / Users / APM Events |
| Infrastructure Costs | Self-managed (Server, Cloud Instance) | Included in SaaS Price |
| Scalability | Linear with Infrastructure | Exponential with Data Volume |
Important for Budget Planning:
With Grafana, you calculate infrastructure costs (AWS/Azure) plus personnel costs for operations. The software itself is free, but you pay for the compute resources to run it. This model is predictable and scales linearly with your infrastructure footprint.
With New Relic, you primarily calculate data volumes. A 10% increase in log data directly increases your invoice. This can lead to budget surprises if data retention policies are not strictly enforced. For teams with a limited budget and high technical competence, Grafana is often cheaper. For teams that want to save time and prefer a predictable, all-inclusive cost structure, New Relic is more attractive.
Strategic Decision Criteria for Your Team
The choice depends heavily on your current maturity stage and team composition. Answer these questions to identify the right platform for your organization.
Choose Grafana if:
- You already have a strong DevOps or SRE team with Kubernetes expertise.
- Data sovereignty and on-premise hosting are a priority for compliance reasons.
- You are already using Prometheus or Elasticsearch as primary data sources.
- You need maximum flexibility for custom dashboards and integrations.
Choose New Relic if:
- You want to see results quickly (Time-to-Value under 1 week).
- You do not have a dedicated monitoring team.
- You are looking for a unified solution for frontend, backend, and infrastructure.
- You want to outsource operational complexity to a provider.
The Hybrid Approach:
Many mid-market companies start with New Relic for quick insights and later migrate critical components to Grafana to reduce costs or improve compliance. However, this requires a clear strategy and robust interfaces to ensure data consistency across both platforms.
Implementation Roadmap and Best Practices
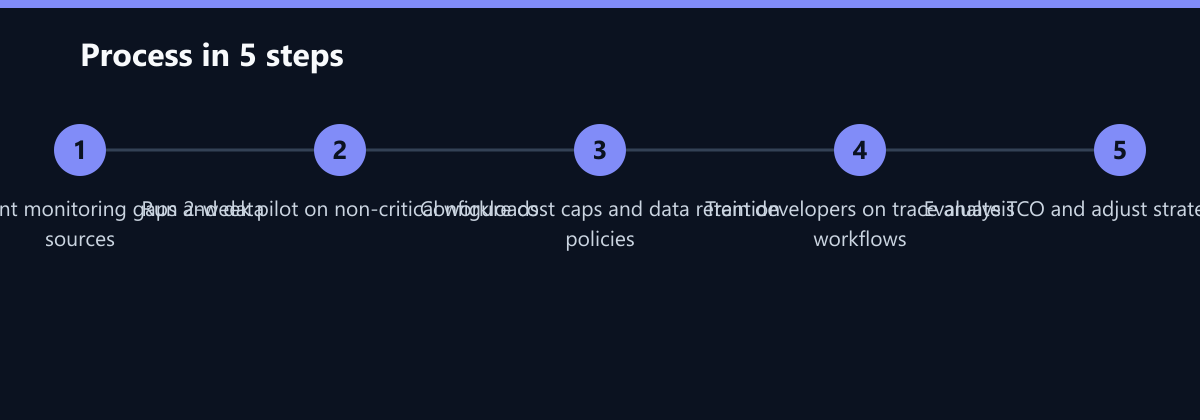
Introducing an observability platform is not a one-time project. It is a continuous process that requires ongoing attention and refinement. Here is a proven approach to ensure success:
- Inventory: Identify which systems need to be monitored. List servers, containers, databases, and APIs. Prioritize based on business criticality.
- Pilot Phase: Start with a non-critical system. Test alerts and dashboards in a low-risk environment to validate your configuration.
- Cost Control: Set strict limits for data ingestion. Avoid collecting unnecessary logs by configuring sampling rates and retention policies.
- Training: Train developers in reading traces and metrics. Empower them to self-serve insights rather than relying on a central ops team.
- Review: Evaluate the cost-benefit ratio quarterly. Adjust data retention and alerting rules based on actual usage and incident patterns.
Typical Mistakes to Avoid
Even experienced teams make errors when adopting observability tools. Here are the most common pitfalls:
- Over-Ingestion of Logs: Collecting every log line without sampling leads to exponential cost increases in SaaS models like New Relic. Implement log filtering early.
- Dashboard Clutter: Creating too many dashboards with irrelevant metrics creates noise. Focus on the vital few metrics that indicate system health.
- Ignoring Alert Fatigue: Configuring too many alerts with low thresholds leads to alert fatigue, where teams stop responding to notifications. Use adaptive alerting or strict severity levels.
- Underestimating Integration Effort: Assuming that installing an agent is enough. You must invest time in configuring exporters, defining data models, and building meaningful visualizations.
How You Measure Success
To ensure your observability investment delivers value, track these Key Performance Indicators (KPIs):
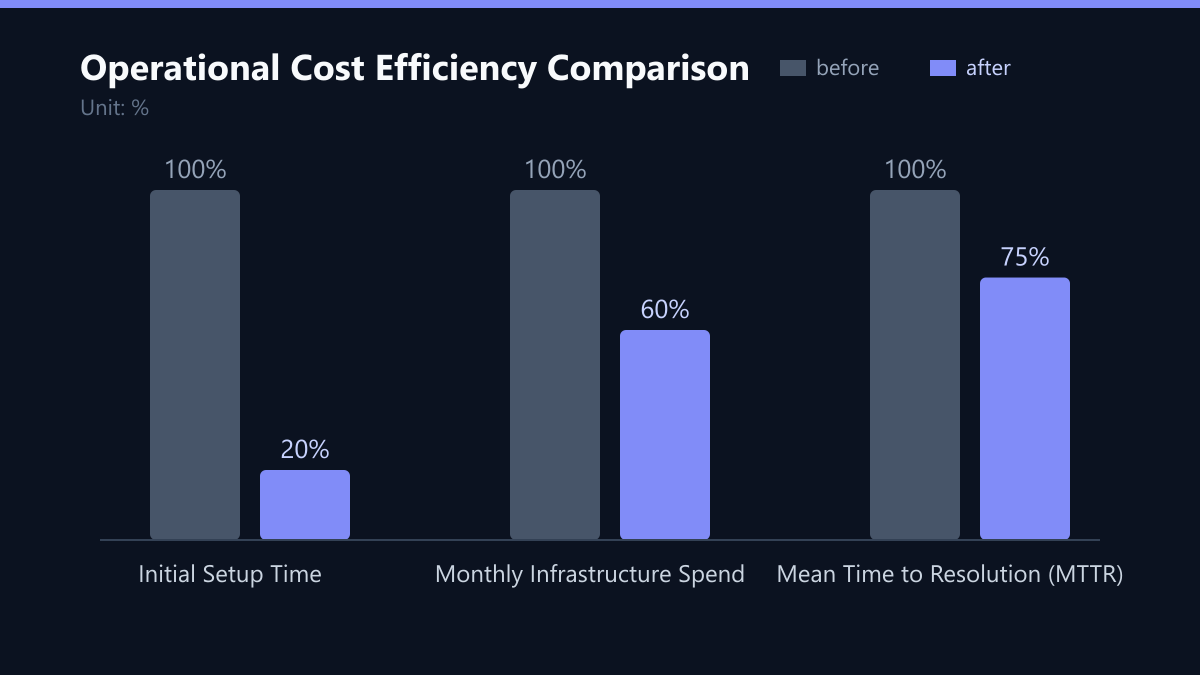
- Mean Time to Resolution (MTTR): The average time it takes to resolve an incident. A successful implementation should reduce this by at least 20-30% within six months.
- False Positive Rate: The percentage of alerts that do not require action. Aim for a rate below 10% to maintain team trust in the alerting system.
- Cost per Incident: Calculate the total observability cost divided by the number of incidents resolved. This helps you understand the ROI of your monitoring stack.
Method: Use your ITSM tool to track incident resolution times. Compare these metrics before and after the implementation. Review these KPIs in monthly operations reviews to ensure continuous improvement.
Conclusion
There is no universally best solution. Grafana offers control and cost advantages with high technical depth, making it ideal for teams with strong engineering capabilities. New Relic offers speed and simplicity with an acceptable cost structure, perfect for teams that need rapid insights without operational overhead.
For the mid-market, the pragmatic path is often the best choice: Start with the platform that solves the biggest bottleneck in your current operations, and remain flexible. Whether you choose the flexibility of Grafana or the simplicity of New Relic, the key is to start with a clear strategy, measure your success, and continuously refine your approach.