The Operational Bottleneck
For a specialized machinery manufacturer in southwestern Germany, the gap between its modern production capabilities and its digital infrastructure had become a significant drag on efficiency. With 120 employees, the company operated in a highly competitive DACH market where lead times and responsiveness are critical differentiators. Despite possessing state-of-the-art machinery, the data flow between the central ERP system and the shop floor was surprisingly primitive. Production data was captured manually, exported to Excel, and communicated via email. This legacy process created a data lag of several hours, rendering real-time decision-making impossible.
The consequences were tangible. Shift leaders spent a disproportionate amount of time manually entering data rather than supervising production. When disruptions occurred, identifying the root cause was a slow, reactive process because there was no central, real-time view of machine status. Responsibilities during downtime were often unclear, leading to prolonged idle times. Management recognized that without a transparent, automated solution, the company’s ability to scale and compete on speed was at risk.
The Challenges
The project faced three primary hurdles that threatened to derail a quick implementation.
- Legacy Heterogeneity: The shop floor featured machines from different manufacturers and vintages, some lacking native digital connectivity. Standardizing data collection without replacing hardware was a technical puzzle.
- Change Resistance: Shop floor staff were accustomed to manual Excel workflows. Introducing a new digital tool required a careful change management strategy to ensure adoption and data quality.
- Real-Time Latency: The requirement for real-time insights meant that batch processing or scheduled syncs were insufficient. The architecture needed to handle low-latency data streams to trigger immediate alerts.
The Tech Stack
We selected a technology stack that prioritized openness, reliability, and minimal intrusion into the existing OT (Operational Technology) environment.
- OPC-UA: Used as the primary communication protocol to ensure secure, vendor-agnostic data exchange from the machine controllers.
- IoT Gateways: Industrial-grade edge devices installed on critical production lines to aggregate sensor data and handle local preprocessing.
- API-Based Middleware: A custom-built middleware layer that translates machine data into a format compatible with the existing ERP system.
- Central Dashboard: A web-based interface built for production managers and shift leaders, focusing on KPIs like lead time and machine utilization.
- Existing ERP: The client’s current ERP system served as the system of record, receiving synchronized data via the new middleware.
Implementation Strategy
Core IT Services developed a tailored integration solution that bridged the gap between the shop floor and the ERP. The implementation was structured into three phases over a period of four months, designed to deliver value incrementally while minimizing risk to ongoing operations.
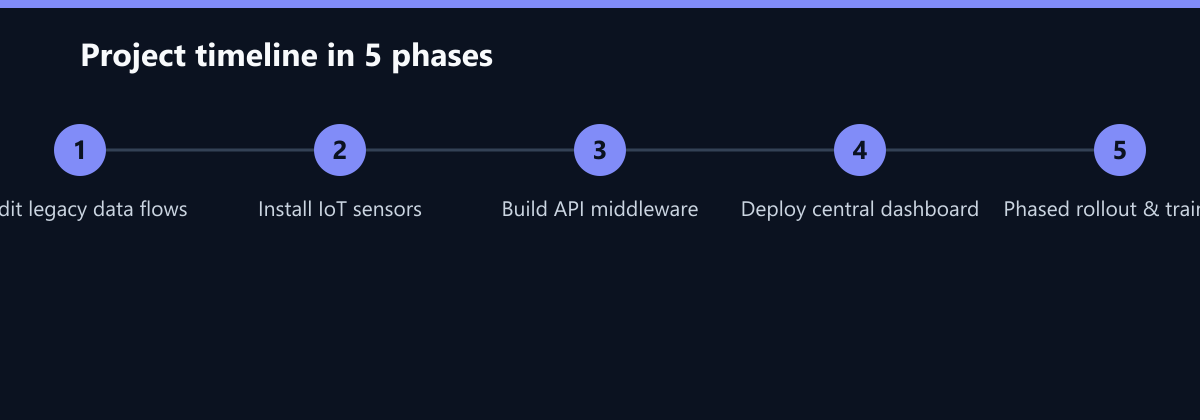
Phase 1: Connectivity and Data Acquisition (Months 1-2) The initial focus was on establishing a reliable data source. We installed sensors and gateways on the most critical production lines. These devices captured status signals, utilization rates, and error codes directly from the machine controllers. By leveraging the OPC-UA standard, we avoided the need for proprietary drivers or hardware replacement. The controllers were simply retrofitted with the necessary interfaces. This phase ensured that we had a clean, standardized data stream before any complex logic was applied.
Phase 2: Middleware and ERP Synchronization (Months 2-3) With data flowing from the shop floor, the next step was to connect it to the business logic. We developed an API-based middleware that acts as a translator and synchronizer. This component ingests the real-time data from the IoT gateways, processes it to ensure integrity, and pushes it into the existing ERP system. This eliminated the need for manual Excel exports. The middleware also handles reverse data flow, ensuring that order status updates from the ERP are reflected in the shop floor dashboard.
Phase 3: Dashboarding and Rollout (Months 3-4) The final phase focused on user experience and adoption. We developed a central dashboard for production management. Unlike complex BI tools designed for senior executives, this dashboard was tailored for shift leaders. It highlighted lead times, active disruptions, and machine health in a clear, at-a-glance format. We conducted training sessions with the shift teams, emphasizing how the tool would reduce their manual workload rather than add to it. The phased rollout allowed us to refine the interface based on user feedback before full deployment.
How We Measured It
To ensure the project delivered tangible value, we established a rigorous measurement framework before implementation began. We defined baseline metrics for the three core KPIs: production lead time, manual data entry volume, and response time to machine failures.
- Production Lead Time: Measured as the total duration from order release to finished good status in the ERP. We tracked this for a sample of 50 representative orders over the month preceding implementation.
- Manual Data Entry: Quantified by time-studying the current process. We measured the average time per shift spent on manual data entry tasks (Excel exports, email communications) and compared it to the post-implementation time spent on system verification.
- Response Time: Defined as the time elapsed between a machine failure signal and the initiation of a corrective action. This was tracked via system logs and maintenance tickets.
All data was collected automatically where possible, using the new IoT infrastructure to ensure objectivity. The results were reviewed weekly during the implementation phase and formally audited after six months of full operation.
Results
After full commissioning and a six-month stabilization period, the impact on production processes was significant. The elimination of manual data entry steps not only saved time but also reduced human error, leading to higher data integrity in the ERP.
The most critical outcome was the 15% reduction in production lead time. By having immediate visibility into bottlenecks, the production team could proactively rebalance workloads and address issues before they cascaded. The 30% reduction in manual data entry freed up shift leaders to focus on quality and safety, improving overall shop floor morale. Furthermore, the 25% faster response time to machine failures was driven by the automatic alerting system, which notified the maintenance team instantly upon detecting an error code, rather than waiting for a human to notice a stopped machine.
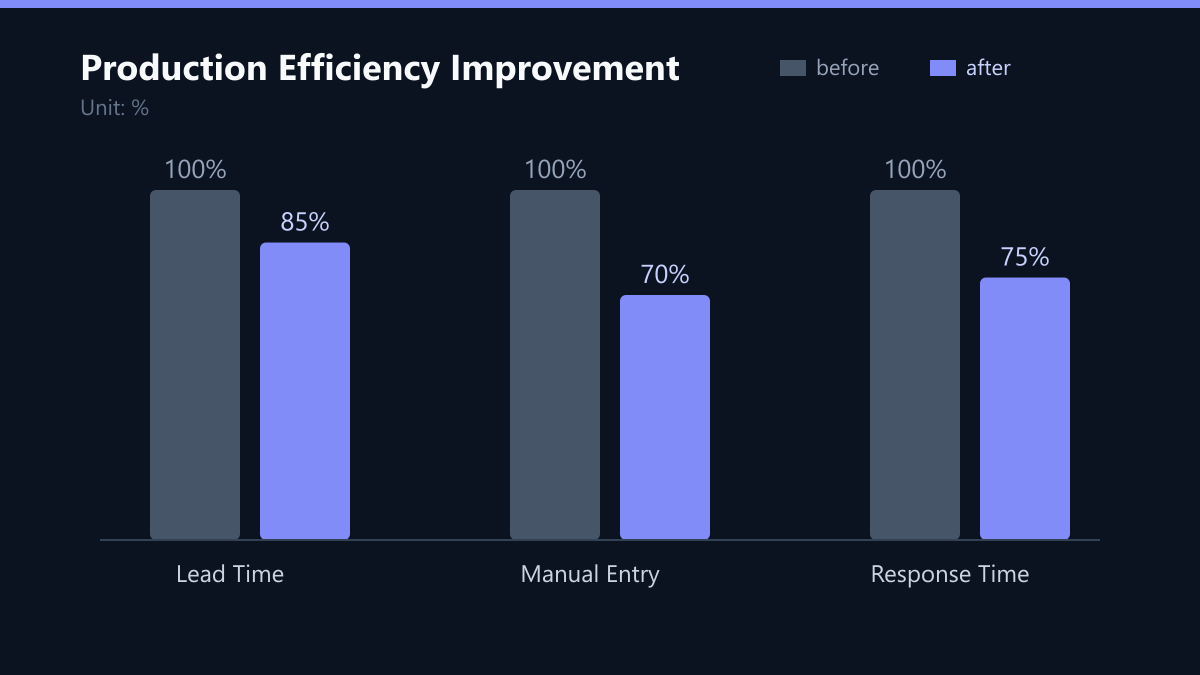
The transparency enabled the team to shift from a reactive to a proactive stance. Instead of reacting to problems after they had already impacted output, they could identify potential bottlenecks in real-time. This cultural shift, enabled by the technology, was perhaps the most valuable long-term benefit of the project.
Lessons Learned
The project demonstrated that a lean, API-based integration is often more efficient and cost-effective than a full ERP replacement. The focus on real-time data rather than historical reports was the key to success. Historical reports are useful for trend analysis, but they do not help resolve current bottlenecks. For shop floor operations, immediacy is paramount.
User acceptance was another critical factor. We found that an intuitive dashboard for shift leaders was more important than complex analytics for senior management. If the people on the floor do not use the tool, the data quality suffers, and the business value vanishes. By designing the interface around the daily tasks of the shift leaders, we ensured high adoption rates.
Finally, the phased implementation approach minimized risk. By delivering quick wins in the early phases, we built trust with the client team. This trust was essential for the successful rollout of the more complex middleware and dashboard components in later phases.
What We Would Do Differently Today
While the project was a success, there are areas where we would refine our approach in future engagements.
- Earlier User Involvement: We would involve shift leaders in the design phase of the dashboard more intensively. While we trained them at the end, their input during the design phase could have led to an even more intuitive interface and faster adoption.
- Predictive Analytics: The current solution is reactive to errors. In a future iteration, we would integrate predictive analytics to anticipate machine failures based on historical data patterns, moving from reactive to predictive maintenance.
- Mobile Access: The dashboard is currently accessed via desktop browsers. Given the mobile nature of shop floor work, we would prioritize a mobile-responsive interface or a dedicated app to allow shift leaders to monitor status from anywhere on the floor.
Passend dazu
- Custom Software vs. Off-the-Shelf: Economic Analysis for the Mittelstand
- IT Consulting & IT Strategy
- AI Consulting & AI Strategy
- Reducing MTTR: Proactive IT Monitoring for 30 Percent Lower Operating Costs
- Cloud Services & Cloud Migration
- IT Compliance & Data Protection
- E-Commerce Development
- Reducing Server Runtime by 40 Percent: Scalable Cloud Architecture for a German B2B Fashion Retailer in Peak Season
- Scaling a Berlin E-Commerce Startup to 50,000 Monthly Orders
- Proactive IT Monitoring Cuts Downtime by 42% at a Mid-Market Machinery Manufacturer
- Production Monitoring for a DACH Machinery Manufacturer: Reducing Unplanned Downtime by 40 Percent with Prometheus and Grafana
- KI-gestützte Rechnungsprüfung im Maschinenbau
- Predictive Maintenance in Machinery: Reducing Unplanned Downtime by 35 Percent with IoT Sensors and AI Analysis in the DACH Region
- API-Integration im Mittelstand: ERP, CRM und E-Commerce verbinden ohne Custom Code
- Logistics Provider in DACH: Scaling from 3 to 15 Servers for TMS Integration with 99.95% Uptime
- Wi-Fi 6E Modernisierung in Stuttgart: Interferenz eliminiert, Produktivität um 35 Prozent gesteigert
- Entwicklung einer IoT-Steuerungsplattform für einen Fertigungsautomatisierer: 25 Prozent Reduktion der Stillstandzeiten in der Produktion
- Automatisierung der Kreditorenbuchhaltung bei einem deutschen Maschinenbauer: Reduktion der Durchlaufzeit um 60 Prozent
- Custom Booking Engine for US Fitness Studio Operator